What you’ll do in Stohb
- Set the date range and location.
- Read item performance and the sales ledger.
- Choose a checked action from the report.
Follow the screens using your own business details. The screenshots were captured in the actual Stohb apps with local guide examples. Prices, customers and results shown are illustrative.
Turn your Stohb sales report into a checked decision
Start with a business question, such as which item to restock or which balances need follow-up. Keep the comparison period consistent.
1. Open Sales Report and set its scope
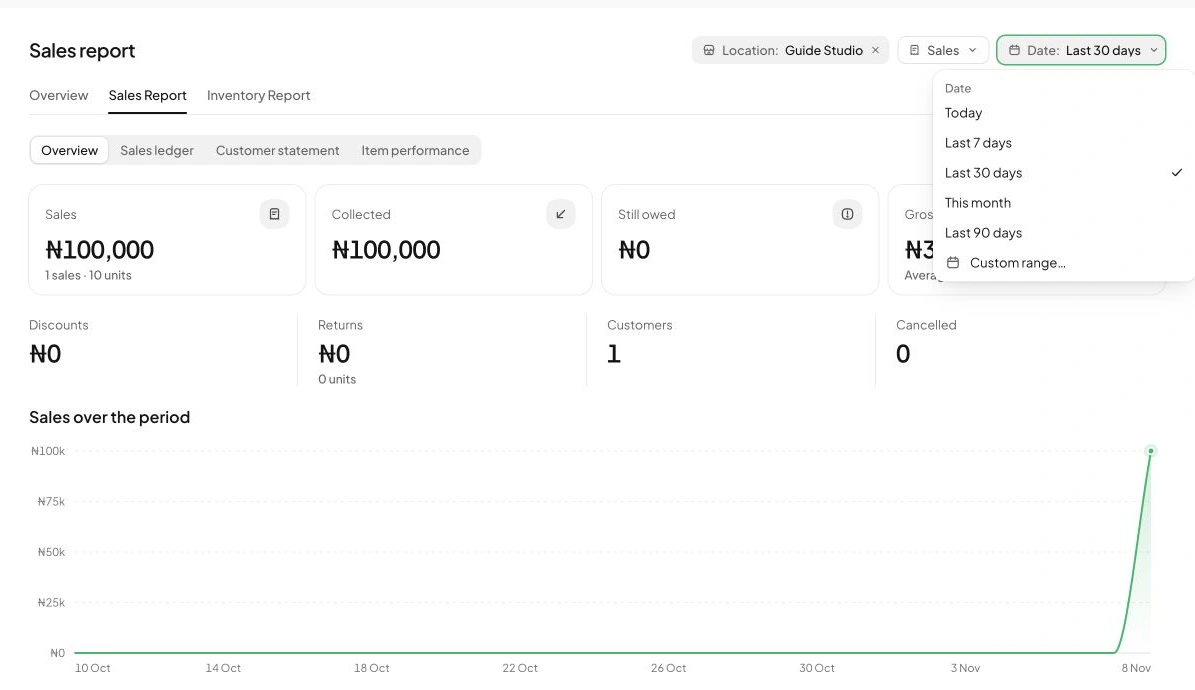
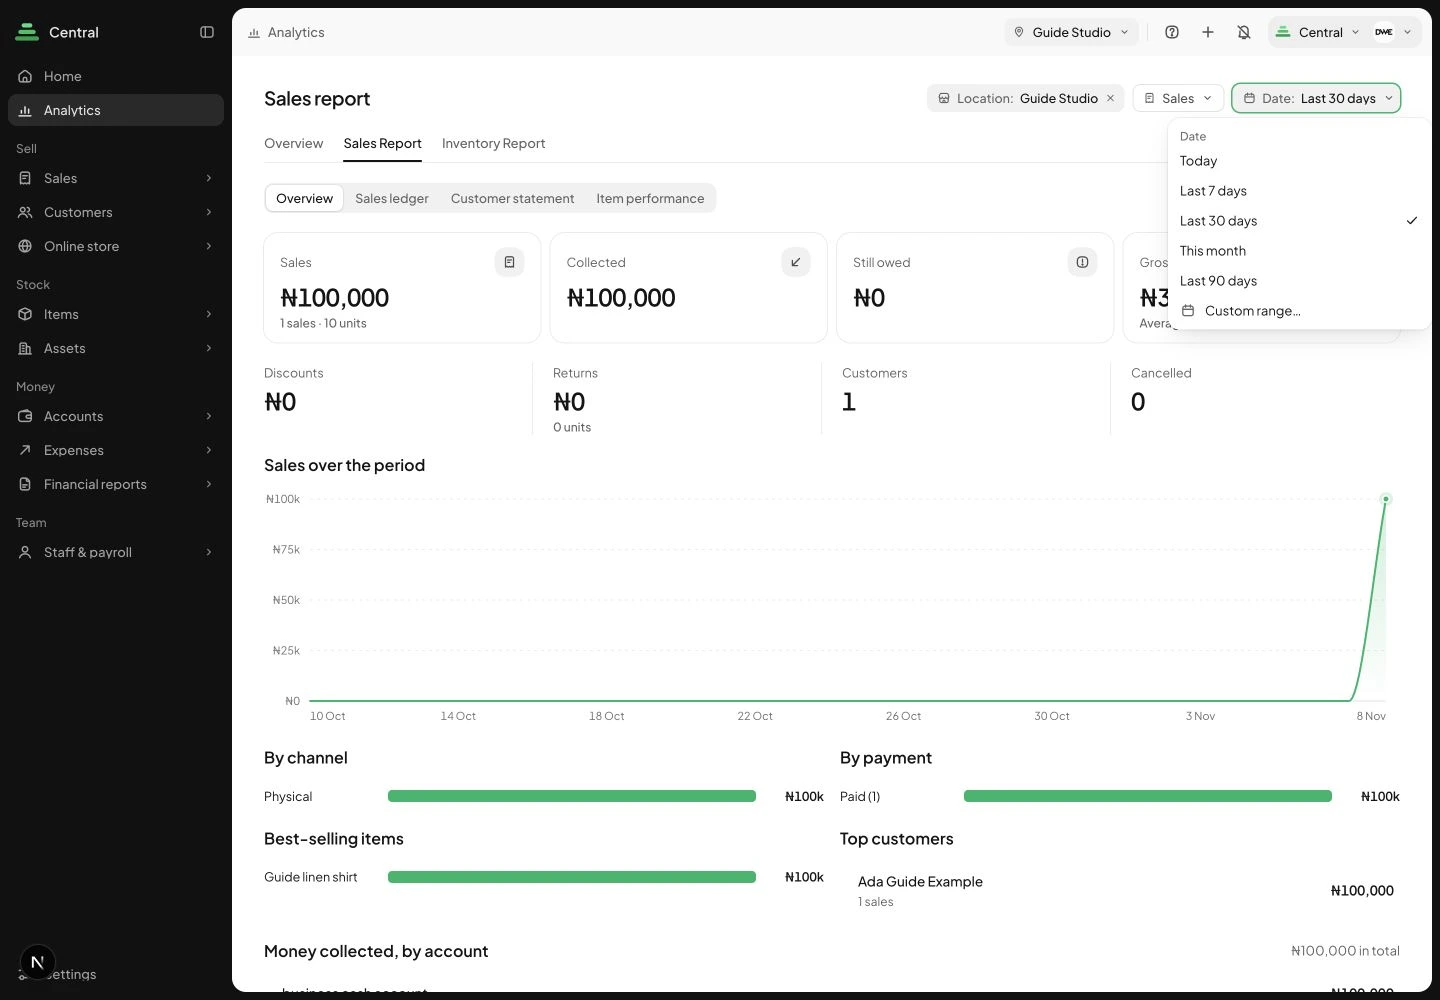
In Central, open Analytics and choose Sales Report. Set Location in the report’s filter bar and choose the relevant Date. The app-header location does not replace this report control. For a comparison, use matching locations and comparable periods; a partial month and a whole month are not equivalent.
 Enlarge screenshot
The date selector inside the real sales report. Check the result: The report scope matches the question you are asking.
2. Check the overview before choosing a cause
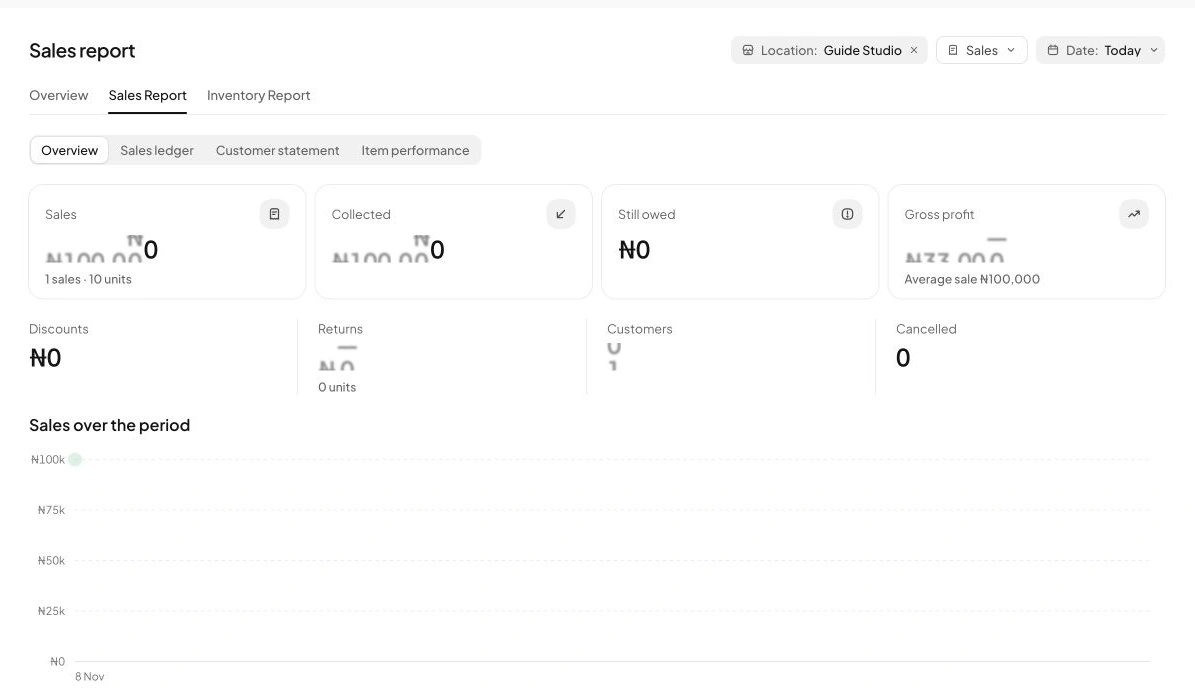
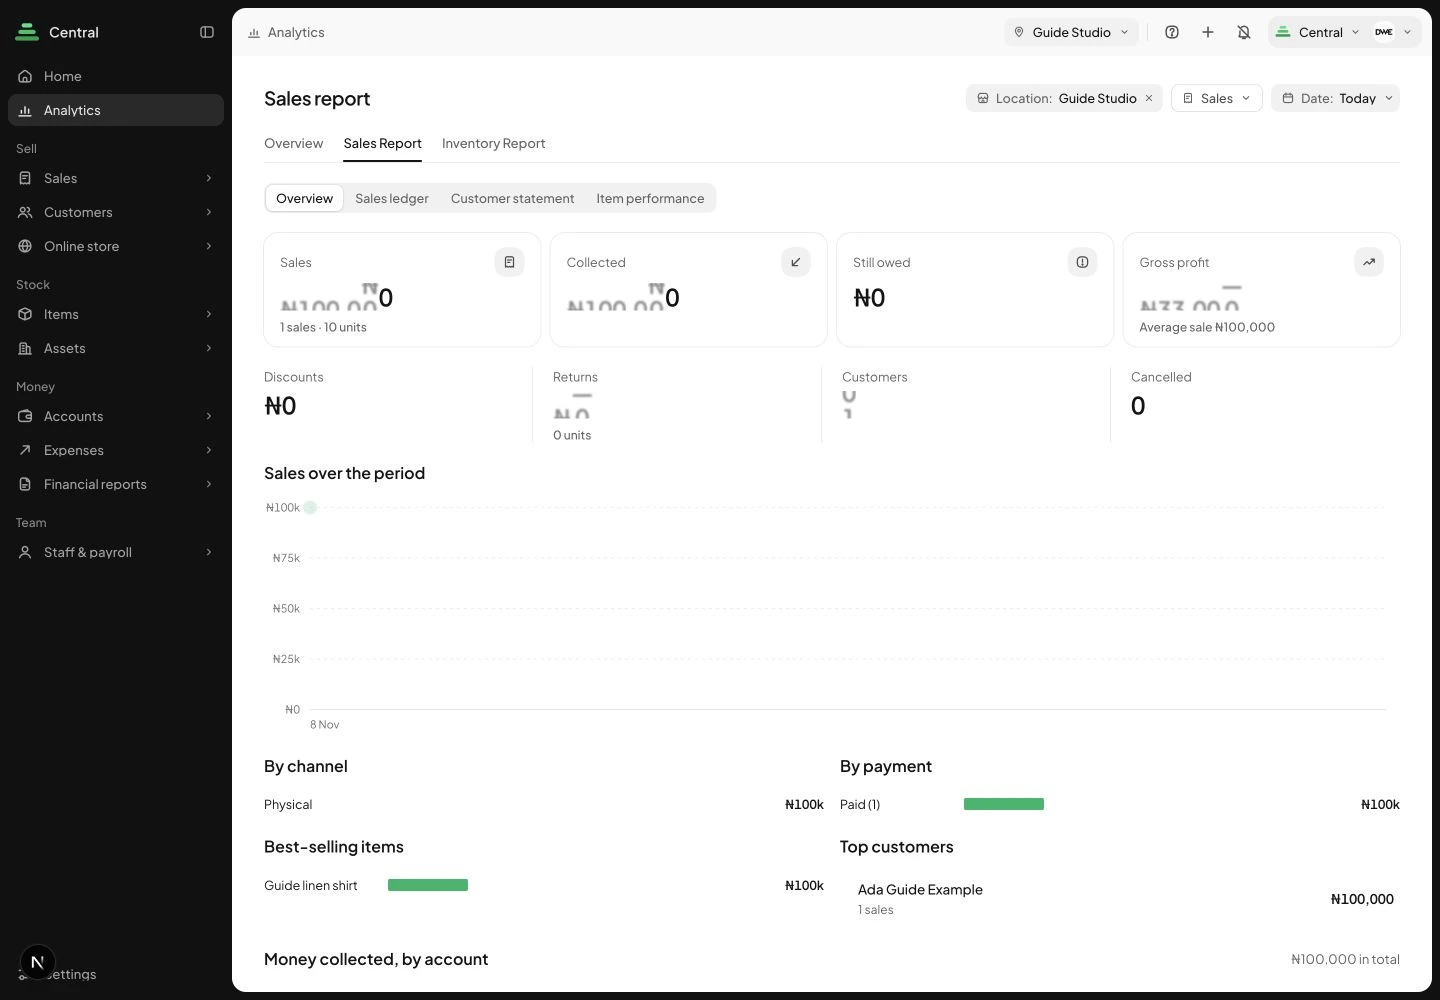
Read Sales, Collected, Still owed and Gross profit as distinct values. Look for the question behind a change: are more sales still unpaid, were products unavailable, or has a cost not yet been recorded? Stohb gives you the figures to investigate, but a higher or lower total does not establish its cause.
 Enlarge screenshot
The overview for the isolated guide example. Check the result: You have a precise observation to investigate.
3. Use Item performance for product decisions
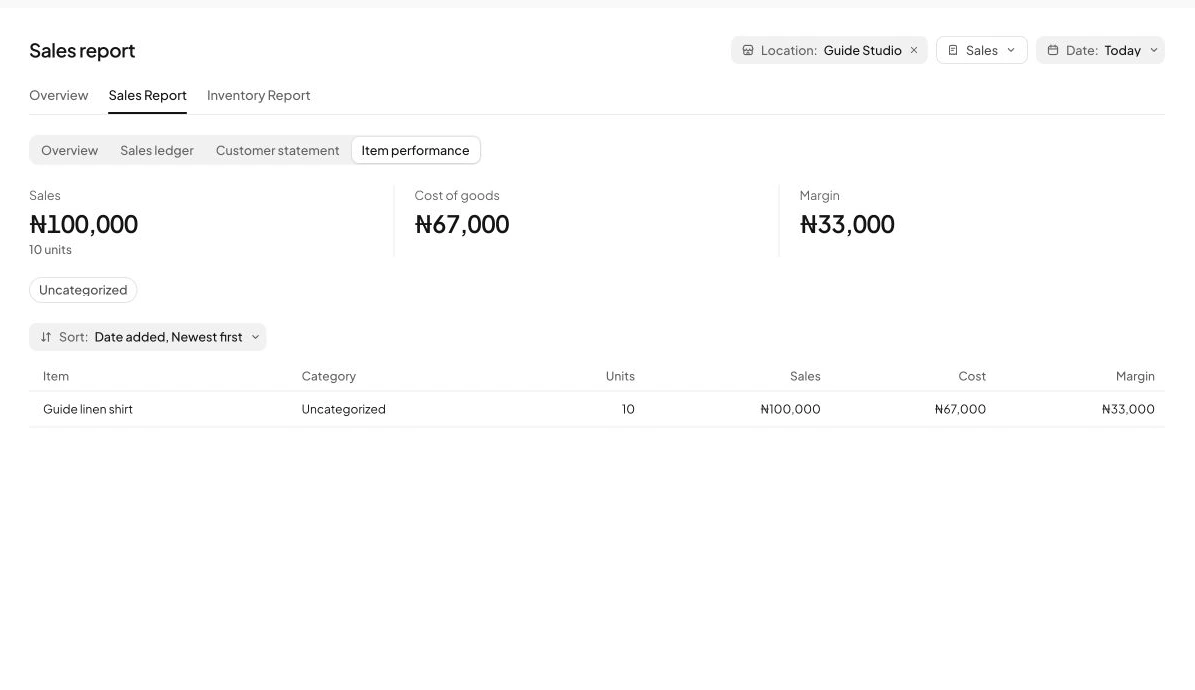
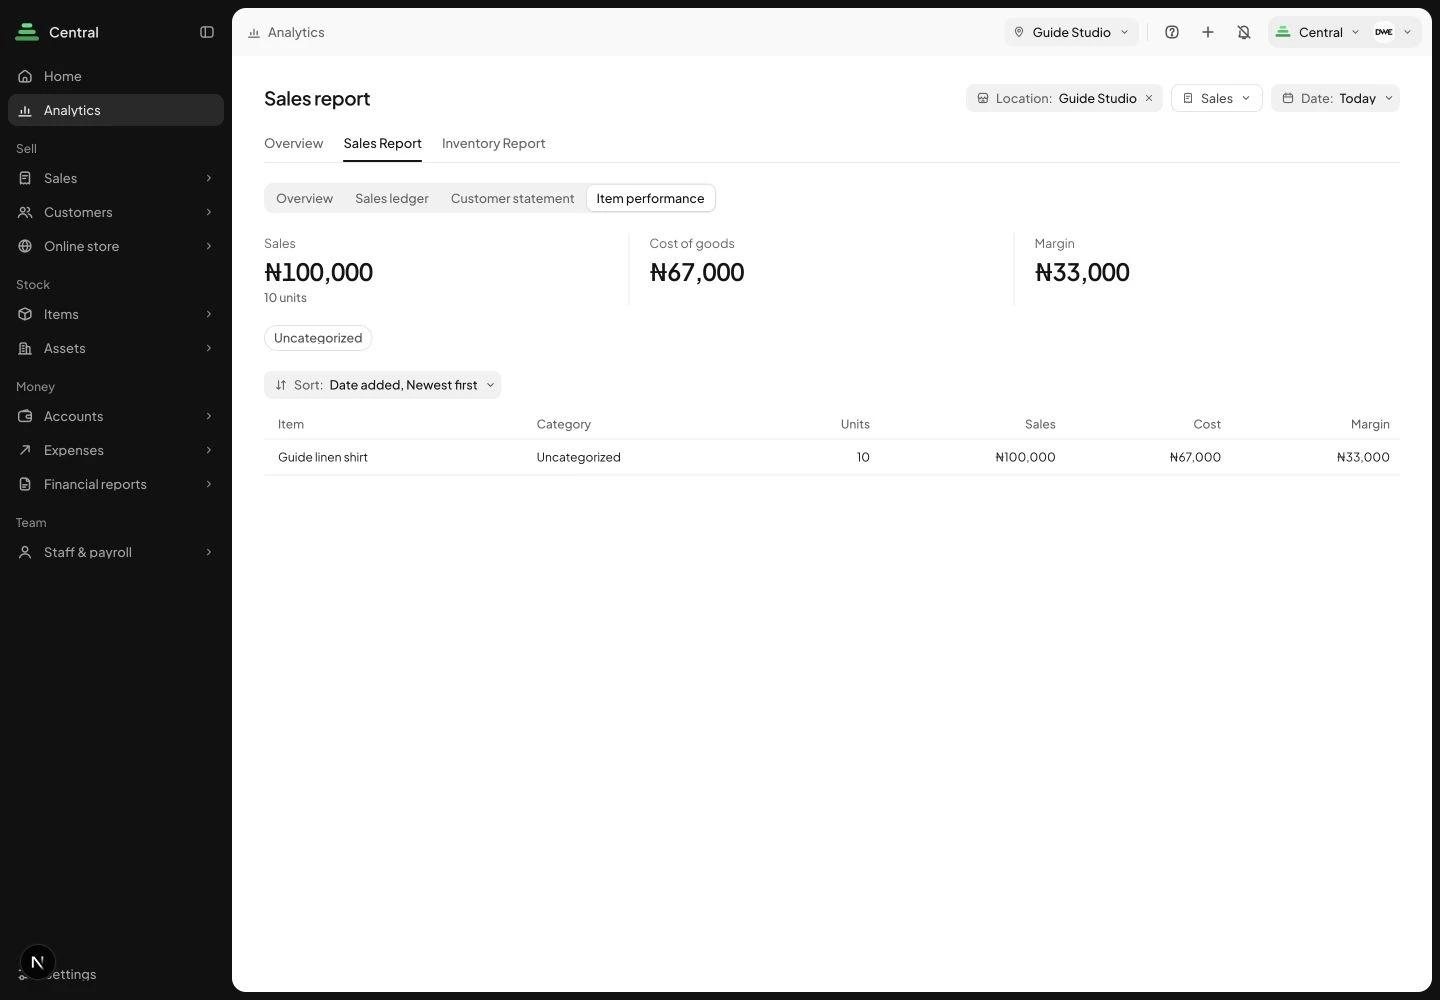
Switch to Item performance. Compare Units, Sales, Cost and Margin. Our example has ten units, ₦100,000 sales, ₦67,000 cost and ₦33,000 margin. Check the product’s availability and supplier timing before turning a high sales figure into a buying decision. Review costs before assuming the most popular item leaves the most money.
 Enlarge screenshot
The real item-performance table with the example’s checked amounts. Check the result: You can connect a restocking or pricing decision to a specific item’s result.
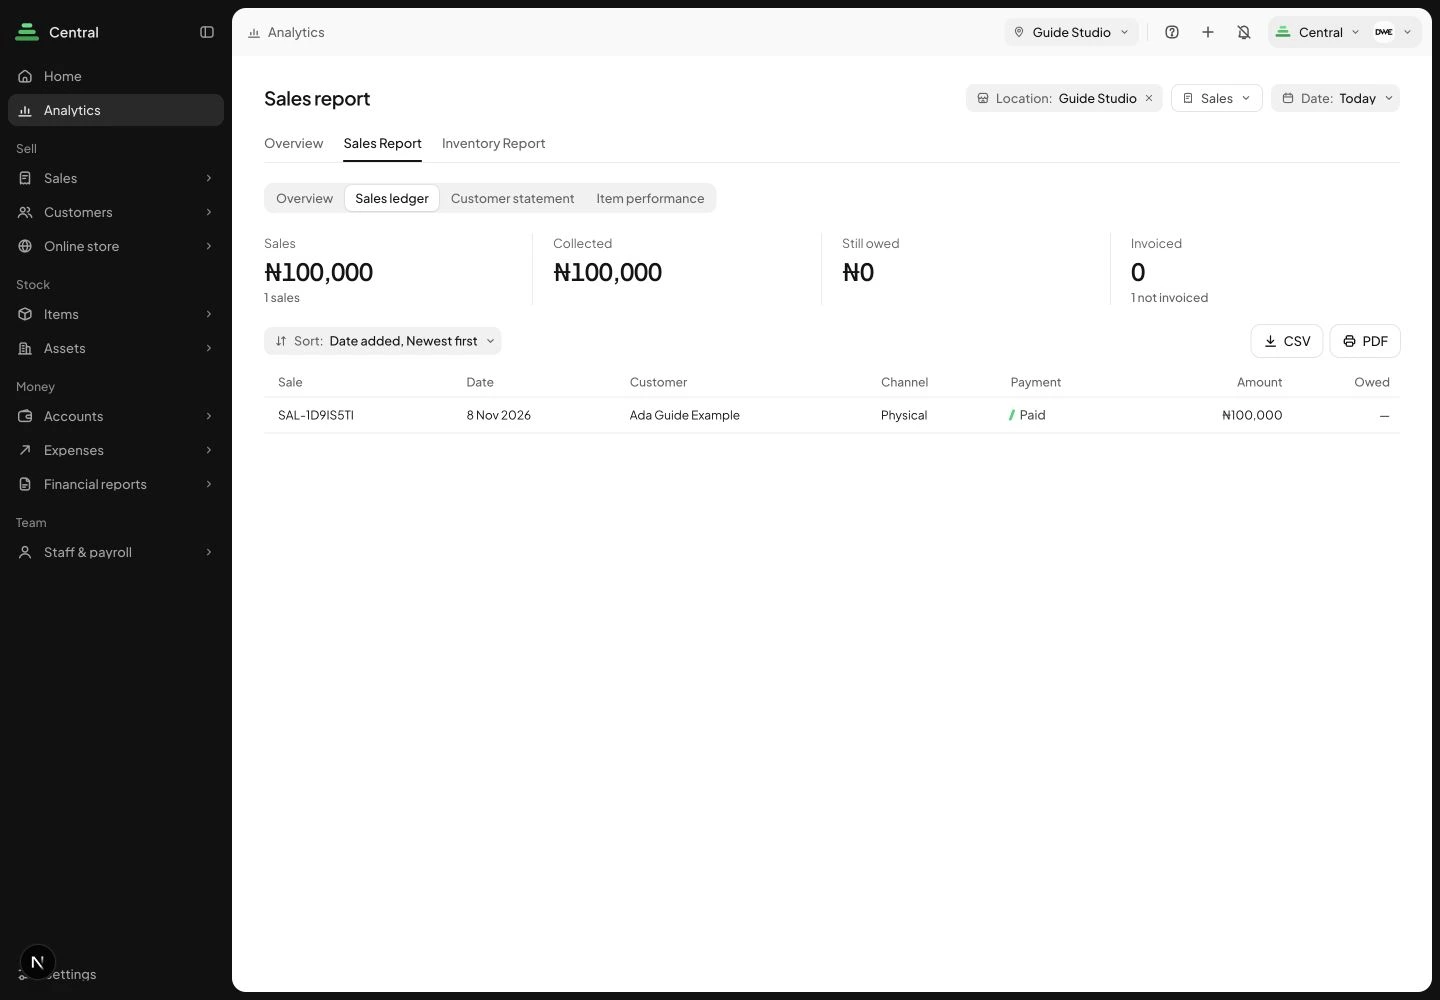
4. Use the ledger to check transactions
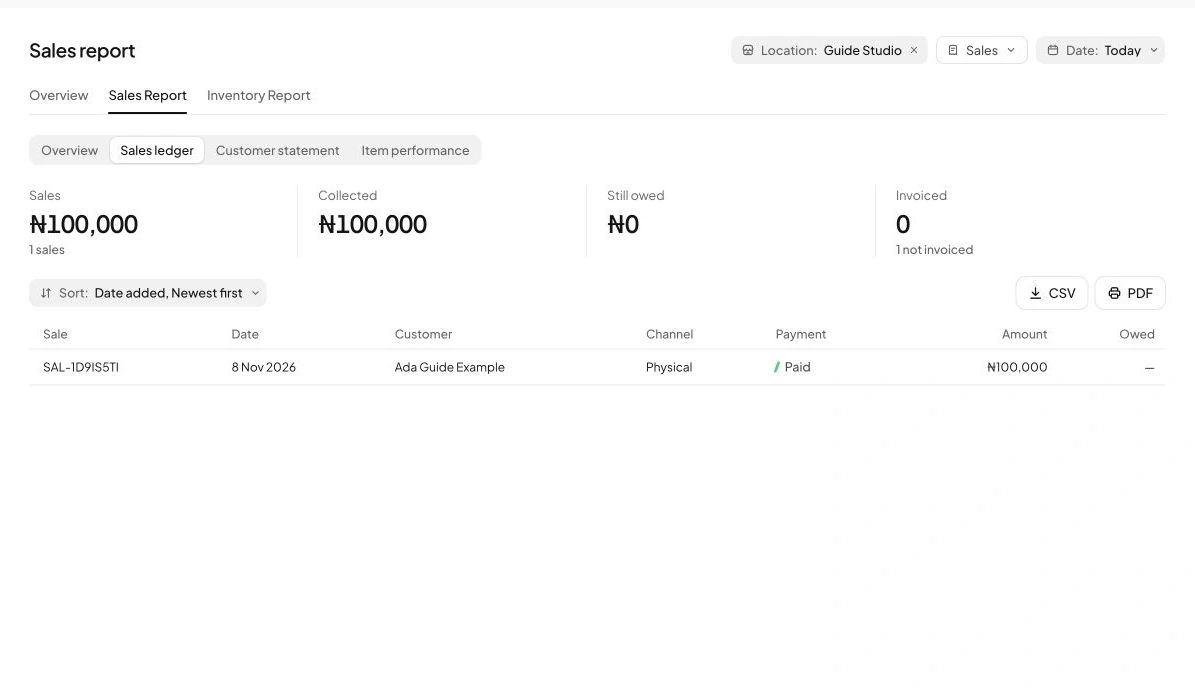
Open Sales ledger when the question concerns a particular order or payment. Find the reference and compare the recorded amount and owed balance. Check the saved sale when you need more detail. Use the export controls when they help your review, and keep any downloaded customer records within the business’s appropriate access arrangements.
 Enlarge screenshot
The transaction behind the guide’s report figures. Check the result: You can trace the observation back to its recorded activity.
5. Write the next action before leaving the report
After checking the evidence, note the observation, the likely explanation, the action and a review date. For example: review the reorder level for an item that was unavailable for several days, then check availability and sales after the next delivery. Return to the same Stohb report scope for the review so you can assess the change fairly.
Enlarge screenshotUse the same item-performance view and a consistent scope when reviewing the decision. Check the result: You leave the report with one specific, checkable next action.
Understand the decisions behind the steps
The app keeps the record useful. These explanations help you decide what to enter and how to interpret what Stohb shows.
Set the report scope before reading the total
Start with the period and location you want to understand. A report for all locations answers a different question from one for a single shop. A month-to-date view answers a different question from a complete calendar month.
Write down the comparison before drawing conclusions. For example: ‘I am comparing the first seven trading days of each month for Ikeja.’ Consistent scope helps prevent a shorter period or a missing location from looking like a business problem.
Learn what each label includes
Sales value, units, cost and margin are related but different. Units count products sold; sales value measures their selling amount. A cost figure depends on the records and treatment used by the report. Margin needs a clear definition before you compare it with a calculation elsewhere.
In Central, use the report labels and underlying records to understand the displayed figures. Check how returns and corrections affect the view. Do not subtract a return again if it has already been reflected in the number you are using.
Compare like with like
Avoid comparing a full month with an unfinished one and calling the difference growth or decline. Consider trading days, unusual closures and changes in what was available to sell. A stockout can reduce sales without proving that customers lost interest.
Promotions also change the context. Higher sales value during a discount period may come with less money left per unit. Record the offer dates and review the relevant costs before concluding that the promotion improved the business’s result.
Look below the overall total
An overall increase can hide products moving in opposite directions. Open the item-level view and inspect quantities, sales and the relevant cost or margin information. Where channel information is available, use it to understand where orders came through without assuming it measures the original marketing source.
In a simplified fictional example, product A sells 100 units with ₦1,000 contribution per unit: ₦100,000. Product B sells 40 units with ₦3,000 contribution per unit: ₦120,000. B contributes more under these assumptions despite selling fewer units. Neither figure is net profit after all business costs.
Investigate a possible cause
Turn an observation into a question you can check. If one size sold less, was it available throughout the period? If orders increased, did returns also increase? If one location looks weaker, were some sales recorded under another location?
Inspect a sample of underlying records and speak to the people handling the work. Reports help identify where to look; a total alone rarely proves why something changed. Keep a distinction between what the numbers show and what you currently suspect.
Choose one action and a review date
Write a short decision note: the observation, possible explanation, check performed, action and date to review. For instance: ‘Medium black shirts were unavailable for four days. Review the reorder level, then check availability and sales after the next delivery.’
Avoid changing prices, stock levels and marketing at once unless the situation requires it. When several things change together, it becomes harder to understand what helped. Keep the next review on a comparable period and check whether the original problem improved before declaring the decision successful.
Before you move on
- Set consistent dates and locations.
- Understand each metric and return treatment.
- Inspect items and underlying transactions.
- Record one evidence-based action and a review date.
A few useful answers
Is the bestselling item always the best one to restock?
No. Consider costs, contribution, demand, availability, supplier timing and cash needed as well as the sales total.
Does a lower total prove demand has fallen?
No. Check the period, stock availability, recording quality and other context before choosing an explanation.